JANNEY: REITS Mirror, Mirror: 2Q16 Revisions to Apartment Same-Store Estimates

FULL REPORT

We are updating our 2016 and 2017 same-store NOI, revenue, and expense growth estimates for the 8 major apartment REITs following 2Q16 earnings (see Figure 1). Importantly, our estimates continue to be predicated on a US economy (including job growth) and interest rates similar to today going forward. We are also not expecting any significant benefit in 2017 from the “odd year bounce” of the last few years. On a weighted average basis, we now expect 4.8% SS revenue growth and 5.5% SS NOI growth for the peer group in 2016 (-10bps from last quarter), and 4.0% and 4.4% in 2017 (-10bps from last quarter), respectively.

AIMCO (AIV) – Management SS NOI growth guidance is +5.5% to +6.5%, with a YTD actual of +5.5%. We are expecting +4.6% SS revenue growth and +5.7% SS NOI growth in 2016, and +4.0% and +4.4% in 2017. Our 2016 estimates are consistent with our previous estimates (following 1Q16 earnings), while our 2017 NOI estimate improved 30bps.

AvalonBay (AVB) – Management SS NOI growth guidance is +5.0% to 5.75%, with a YTD actual of +6.4%. We are expecting +4.7% SS revenue growth and +5.6% SS NOI growth in 2016, and +3.9% and +4.3% in 2017 based on additional softening in NYC and SF. Our 2016 estimates have been revised downward (consistent with AVB’s own guidance), while our 2017 estimates are marginally lower (-10bps).

.

Camden (CPT) – Management SS NOI growth guidance is +4.0% to +4.5%, with a YTD actual of +5.1%. We are expecting +4.2% SS revenue growth and +4.4% SS NOI growth in 2016, and +3.8% and +4.0% in 2017. Our 2016 estimates have been revised slightly upward on lower expenses, while our 2017 estimates remain unchanged.

Equity Residential (EQR) – Management SS NOI growth guidance is +3.75% to 4.25%, with a YTD actual of +5.9%. We are expecting +3.7% SS revenue growth and +4.2% SS NOI growth in 2016, and +3.6% and +3.8% in 2017 based on additional softening in NYC and SF. Our 2016 estimates have been revised downward (consistent with EQR’s own guidance), while our 2017 NOI estimate is now 40bps lower.

.

Essex (ESS) – Management SS NOI growth guidance is +7.7% to +8.5%, with a YTD actual of +8.5%. We are expecting +6.9% SS revenue growth and +8.4% SS NOI growth in 2016, and +5.4% and +6.4% in 2017 based on additional softening in NoCal. Our 2016 estimates have been revised downward by 20bps (ESS also lowered its guidance), while our 2017 estimates are roughly flat as we had been expecting some reversion to the mean on the West Coast next year.

Mid-America (MAA) – Management SS NOI growth guidance is +4.75% to +5.25%, with a YTD actual of +6.4% (note: MAA is 1 of 2 to raise their SS NOI guidance this year). We are expecting +4.3% SS revenue growth and +5.0% SS NOI growth in 2016, and +3.7% and +4.0% in 2017 as MAA has more difficult occupancy comparisons going forward. Our 2016 NOI growth has been revised upward by 70bps on both higher revenue and lower expense growth, while our 2017 NOI estimate is now 30bps higher given our expectations of continued strength. Our numbers for 2017 do not include PPS.

.

Post (PPS) – Management SS NOI growth guidance is +2.5% to +3.3%, with a YTD actual of +2.9% (note: PPS is the other that raised their SS NOI guidance this year). We are expecting +3.1% SS revenue growth and +2.7% SS NOI growth in 2016, and +3.1% and +2.7% in 2017 for the legacy PPS portfolio (PPS' announced acquisition by MAA should close by YE2016). Our 2016 NOI growth has been revised upward by 40bps on slightly higher revenue and 30bps lower expense growth.

.

UDR (UDR) – Management SS NOI growth guidance is +6.5% to +7.0%, with a YTD actual of +6.8%. We are expecting +5.6% SS revenue growth and +6.6% SS NOI growth in 2016, and +4.2% and +4.7% in 2017, making UDR second to only ESS in terms of expected 2017 performance. Our 2016 NOI growth remains in-line with our previous expectations, while our 2017 NOI estimate is now 60bps higher given our expectations of continued strength in UDR’s non-core markets.

Buy-rated AIV, MAA, and EQR remain our favorite names in the apartment REIT space.

Japan REIT sector - REITs up despite ex-dividend date for 11 REITs

FULL REPORT

Stocks should benefit from BOJ buying, REITs seem also to be in favor

TOPIX rose 2% on 29 August from the previous trading day. The main factor was likely the yen's retreat following the Fed chairwoman's lecture and comments by BOJ Governor Haruhiko Kuroda at the symposium at Jackson Hole, Wyoming, on 26 August. Amid these conditions the TSE REIT index rose 0.5% on 29 August despite it being the ex-dividend date for REITs with August-ending fiscal periods (ie, 11 of the 54 REITs). After nearly doubling its annual ETF buying target to roughly ¥6trn (from ¥3.3trn) at the 29 July Monetary Policy Meeting, the BOJ bought ¥71.9bn in ETFs on both 25 and 26 August, roughly double the daily amount of BOJ ETF buying up to 3 August. Even so, TOPIX continued to fall d-d on 25 and 26 August. On the other hand, the BOJ did not buy REITs on 25 or 26 August, but the TSE REIT index rose each day nonetheless. Judging from these market conditions, our view is that market participants feel safer in REITs than stocks.

NOMURA - Sanki Engineering (1961 JP) (Neutral) Effect of suspension not clear yet

FULL REPORT

Real estate business also warrants attention

In Apr-Jun 2016, operating losses narrowed to ¥0.3bn, from ¥0.6bn the year earlier, although Apr-Jun results make only a small contribution to full-year results owing to seasonal factors. Losses narrowed owing to an increase in revenues in the machinery systems business, offsetting an increase in provisions against construction losses in the facilities construction business, which includes the HVAC systems for buildings business. As announced by the company on 23 June, the government suspended the company from participating in bids and contracts for 30 days, from 8 July to 6 August, in connection with antitrust law violations. We will be paying close attention to the effect of the suspension on earnings in Jul-Sep and beyond. Peers that were similarly suspended in 15/3 saw earnings adversely affected in cases where the companies also refrained from actively taking on work in the private sector. We make no change to our operating profit forecasts, but we lower our target price as we cut our target P/E to 11-12x, from 16-17x previously, to reflect trends in the benchmark P/E and other factors.


DNB NEWS & RESEARCH for 8/30th...EUROPE +1% led by FINANCIALS

RESEARCH:
LUNDIN PET:  REIT BUY,  UP PT from SEK155(162) Positive Johan Sverdrup news
DETNOR:      REIT BUY,  UP PT from NOK125(128) better production level,lower cap
STATOIL:     REIT BUY,  PT NOK160support update on development costs in Norway
AURORA LPG:  REIT HOLD,CUT PT NOK22.50(11)

DNB NEWS & RESEARCH for 8/29..UK CLOSED BANK HOLIDAY EUROPE VOLS -60%

SKANSKA:     U/G from HOLD(BUY), UP PT from SEK185(220) improved USA outlook
LUNDIN PET:  REIT BUY,  UP PT from SEK155(162) Positive Johan Sverdrup news
DETNOR:      REIT BUY,  UP PT from NOK125(128) better production level,lower cap
STATOIL:     REIT BUY,  PT NOK160support update on development costs in Norway
AURORA LPG:  REIT HOLD,CUT PT NOK22.50(11)
AF GRUPPEN:  REIT SELL, UP PT from SEK90(100) concern remains premium valuation

NOMURA - Maeda (1824 JP) (Buy) Focus on sales growth, concessions

FULL REPORT

Pulling away from rivals by ending its dependence on contracting work

Maeda performed well in 17/3 Q1, generating a gross margin of 9.9% on building construction projects and overall operating profit growth of 26% y-y. We raise our profit forecasts, having lifted our outlook for the gross margin on building construction projects. While some investors may be concerned that the gross margin on building construction projects is high in historical terms and offers only limited scope for improvement from 18/3 onwards, we note that the order book has been rising and that sales growth from 18/3 onwards is likely to lend further impetus to profit growth. Maeda has also established a subsidiary to operate a toll road concession in Aichi Prefecture, and it will be interesting to see how it contributes to earnings. We have raised our target price to reflect upward revisions to our profit forecasts and a rise in the benchmark P/E.

STIFEL: Office/Industrial REITs - Office & Industrial REIT Metrics Update 8/26/16 - With Two Upcoming Conference Calls

FULL REPORT

Office & Industrial REIT Metrics Update 8/26/16 - With Two Upcoming Conference Calls

  • We will hold our semi-annual Funds Flow Update conference call on 31 August 2016 at 11 AM ET. The invitation is attached. There are a number of moving pieces including positive Japanese retail funds flows and the strength of ETF funds flows relative to weakness in actively managed funds flows.
  • Also on the schedule is our semi-annual NAV Creation/Destruction Update conference call, which is scheduled for 7 September 2016 at 11AM ET. Again, this invitation is attached.
Pricing as of close 8/26/16
 
  • Despite excellent YTD 2016 performance, we continue to like Industrial REITs and have Buy ratings on six of the eight we cover. We expect industrial fundamentals to continue to modestly surprise to the upside and look attractive relative to other property sectors.
 
  • Despite recent positive performance following 2Q16 earnings calls, we continue to favor Gateway City office REITs including Vornado (VNO, Buy, $102.24), SL Green (SLG, Buy, $115.52), Empire State Realty Trust (ESRT, Buy, $20.98), and Kilroy Realty (KRC, Buy, $70.26) due to a combination of fundamentals, real value-add platforms and attractive valuations relative to suburban or low barrier office REITs, which are often (but not always) encumbered by weak fundamentals and a pension fund advisor type, generic platform.

Along with the two invitations to our aforementioned conference calls, the most recently updated Office and Industrial REIT valuation metrics are attached as Exhibits.


Below, we have our 2Q16 Earnings wires for each company under coverage (in chronological order from most recent reporter to first reporter):


  • Douglas Emmett (DEI, Sell, $36.98) - Staying with the southern California theme, we think the West L.A. and SoCal office markets are solid, but we still have questions regarding DEI. Beach Volleyball. What Else? Maintain Sell.
     
  • Equity Commonwealth (EQC, Hold, $30.63) - Sooner rather than later EQC will have some serious decisions to make regarding the portfolio they want to own in the long term. Javelin Throw? Javelin Catch? Hold.


Links to our most recent office and industrial REIT sector wires follow:


STIFEL: WRE ($32.06, Hold) - Maryland Athletes Win Twenty Olympic Medals While WRE Happy to Exit Maryland Office Market. NDR Recap. Hold

FULL REPORT

FULL MODEL

Maryland Athletes Win Twenty Olympic Medals While WRE Happy to Exit Maryland Office Market. NDR Recap. Hold.

  • As the summer draws to a close, we accompanied Washington REIT on an NDR; reviewing their core portfolio and -- now that they have an attractive cost of capital -- growth opportunities.
  • We note that while Maryland athletes won 20 Olympic medals, the WRE management noted that there is zero correlation between Maryland athletic prowess and Suburban MD office market dynamics. Hence, exiting their suburban MD office assets for $240mm and a very high $200/SF was Olympic gold for WRE.
 
  • Key take-aways included: 1) proforma the suburban office asset sales the portfolio NOI will be comprised of 46% office, 30% apartment and 24% retail, 2) deleveraging is occurring with net debt/EBITDA falling from 6.6x at 4Q15 to an expected 6.1x-6.3x by YE16, 3) strong job growth in the DC MSA is sustaining demand for apartments and retail sales, 4) the affordability gap between Class A and Class B apartments appears to be increasing, improving WRE's ability to raise rents in its Class B apartments, despite all the recent new supply delivered in the DC MSA, and 5) the appeal of METRO accessible office properties is apparent as net office absorption in Northern Virginia between 1/1/15 and 6/30/16 in assets within 1/2 mile of METRO stations is positive 1.8mm SF. For those assets further away, net absorption was negative 1.3mm SF for the same period. Sixteen of WRE's proforma eighteen office properties are within half a mile of a METRO.
 
  • One of the few REITs we cover that has an internal research team and focuses on only one market, we are always interested in the WRE perspective on the multiple asset classes and the ability to create value primarily through acquisition and redevelopment in the Washington, D.C. MSA.
 
  • Based on recent transactions and forward expectations, it appears that WRE is much more interested in spending capital on inside the Beltway Virginia-centric apartment development and redevelopment than 'office capex hogs'.

 
  • Additionally, please see our Washington, D.C. update wire (here). The greater D.C. office market is recognized as one of the most expensive markets in the country for re-leasing office space.
 
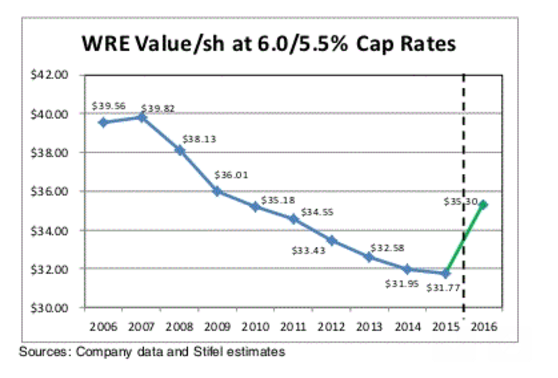
  • We estimate WRE currently trades at 5.9%/4.7%/4.2% implied cap rates for NOI/cash flow/CF less G&A. This equates to (9.0%)/3.0% discount/premium to our NAV estimate of $35/$31/sh using our just reduced NAV cap rate range of 5.5%-6.0%.
  • We adjusted our NAV cap rate range as a result of the cumulative efforts to reposition the office portfolio while reducing its overall percentage of NOI. Once the suburban office asset sales are completed in 3Q16, WRE's NOI will be composed of 46% office, 30% apartments and 24% retail. We believe this is an improvement from the 4Q15 composition of 55% office, 20% apartments and 25% retail.
 
  • In addition to adjusting our NAV cap rate range, we are also adjusting our NAV static cap rate analysis to reflect the portfolio's improving quality.
Screen Shot 2016-08-26 at 7.53.45 PM.png
  • This adjustment creates a one-time pop to NAV. Where the value goes hereafter will once again depend upon management's ability to create value in a still challenging Washington, D.C. environment. WRE's improved cost of capital, should help in this respect.


  • It appears as if all REITs (all sectors) that are generating reasonable (5%+) FFO/FAD growth, can grow the dividend and own institutional quality assets are trading sub 5.3%. As WRE clearly owns institutional quality assets, share price appreciation appears likely if the portfolio starts generating earnings and dividend growth.


  • We think the post suburban office portfolio sale TEV for office space of $455/SF is fair relative to our recently updated $592/$433/SF estimates for gross/adjusted replacement cost.


  • Other positive aspects include 1) improved balance sheet, 2) improved portfolio, 3) while the Washington, D.C. economic recovery lagged the U.S. 2011-2015, it is now exceeding the U.S., 4) Washington, D.C. leads the nation in millennial as a percentage of the population, and 5) WRE has internal redevelopment opportunities for both office and apartment assets.


  • Negatives include 1) there is not a shortage of talented developers in the Washington, D.C. MSA, 2) land is available near a large number of METRO stops, 3) significant apartment supply, 4) surprising continued office development in select markets.


  • We are adjusting our 2016 FFO/FAD/sh estimates to $1.77/$1.28 from $1.77/$1.32 and our 2017 FFO/FAD/sh estimates to $1.81/$1.30 from $1.80/$1.29. This equates to normalized FFO/FAD 2015-2017 growth of 2.9%/2.8%.